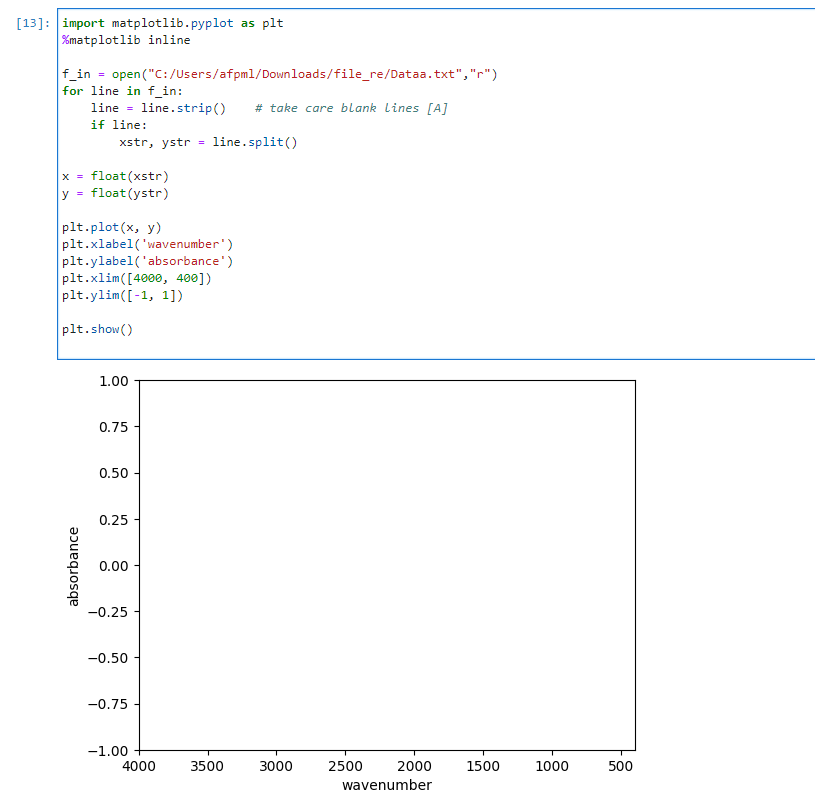
x, y값이 나와있는 텍스트 파일로 그래프를 그리려고 하는데 그래프가 잘 안그려져서 질문 드립니다.
왜 그런것일까요? 텍스트 파일이 전혀 입력되지않는걸까요?..
import matplotlib.pyplot as plt
%matplotlib inline
f_in = open("C:/Users/afpml/Downloads/file_re/Dataa.txt","r")
for line in f_in:
line = line.strip() # take care blank lines [A]
if line:
xstr, ystr = line.split()
x = float(xstr)
y = float(ystr)
plt.plot(x, y)
plt.xlabel('wavenumber')
plt.ylabel('absorbance')
plt.xlim([4000, 400])
plt.ylim([-1, 1])
plt.show()
 image url)
